SQL Server Reporting Services Series – Part I: Setting Up Your First Report
This is going to be the first in a series of blog posts about Microsoft’s SQL Server Reporting Services (SSRS). Each post will build off of a previous one so I will be sure to let you know where to start in future posts.
SSRS gives you the ability to create and manage reports from a variety of data sources. For us, the most used data source is SQL Server but we have also used SQL Azure and MySQL.
Requirements / Setup
For these posts I will be working with SQL Server 2012, Visual Studio 2013 and the Adventure Works database (https://learn.microsoft.com/en-us/sql/samples/adventureworks-install-configure?view=sql-server-ver16&tabs=ssms).
SSRS does have a Report Builder but I have not used it much so will not be going over it and instead have built them using Visual Studio. In order to create report projects you will need to download SQL Server Data Tools (listed as SQL Server Tooling on this page) as well as SSDT-BI for Visual 2013 here: https://msdn.microsoft.com/en-us/data/hh297027.
Now that our environment is set up we can jump into Visual Studio.
Visual Studio Project Setup
The first thing you should notice when doing a File > New Project is the new Template section named Business Intelligence that was created with the SSDT-BI updates. We are going to select the Reporting Services and the Report Server Project. Choose a name and select OK.
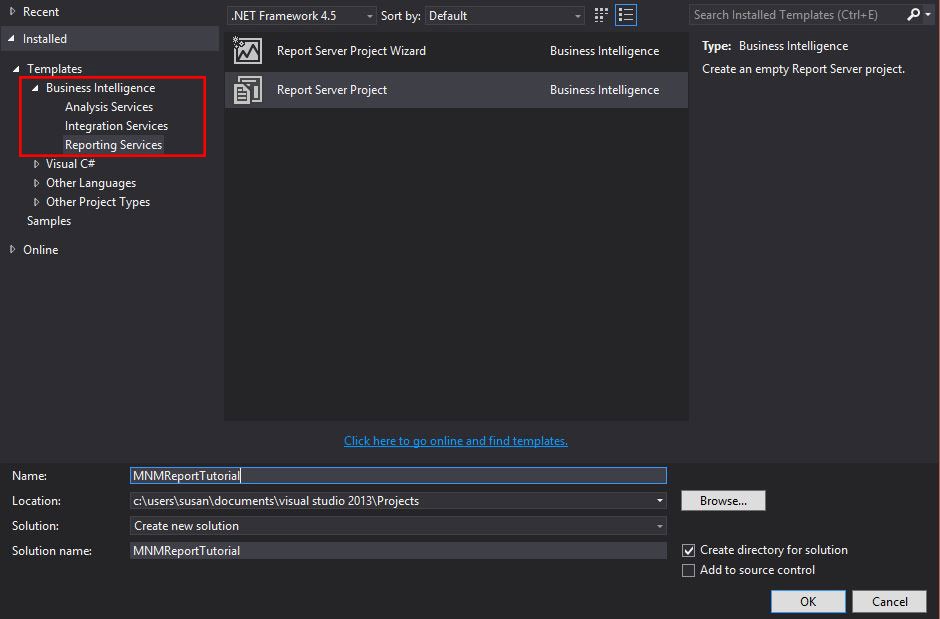
Report projects start out very empty with only three folders – Shared Data Sources, Shared Datasets and Reports.
Shared Data Sources
A data source is the connection to where your data is stored which could be SQL Server, MySQL, SQL Azure or any of the other listed connections. You can have multiple Data Sources in a project if your reports need to get data from multiple places. Data Sources have the extension .rds.
Shared Datasets
Datasets are the queries used to get your data from a Data Source. You can retrieve data from a specific table, write a query right in the Dataset or from a Stored Procedure stored at the Data Source. A Dataset must have a Data Source. Datasets have the extension .rsd.
Reports
If you can’t tell from the name of the folder, this is where the report files are kept. Reports have the extension .rdl
Also note the “Shared” in the folder names. As you will see later you can create Report specific Data Sources and Datasets but the ones in this folder can be accessed by all of the reports in the project.
Connecting to a Data Source
First step in the process to create a report is to set up a Data Source. For the most part in this series I will be using a connection to SQL Server 2012.
Right-click on the Shared Data Sources folder and Add New Data Source. You are presented with a screen to name your Data Source, select the type of connection and add a connection string. You can paste/type in the connection string in the text area or click the Edit button to have it build the connection string for you.
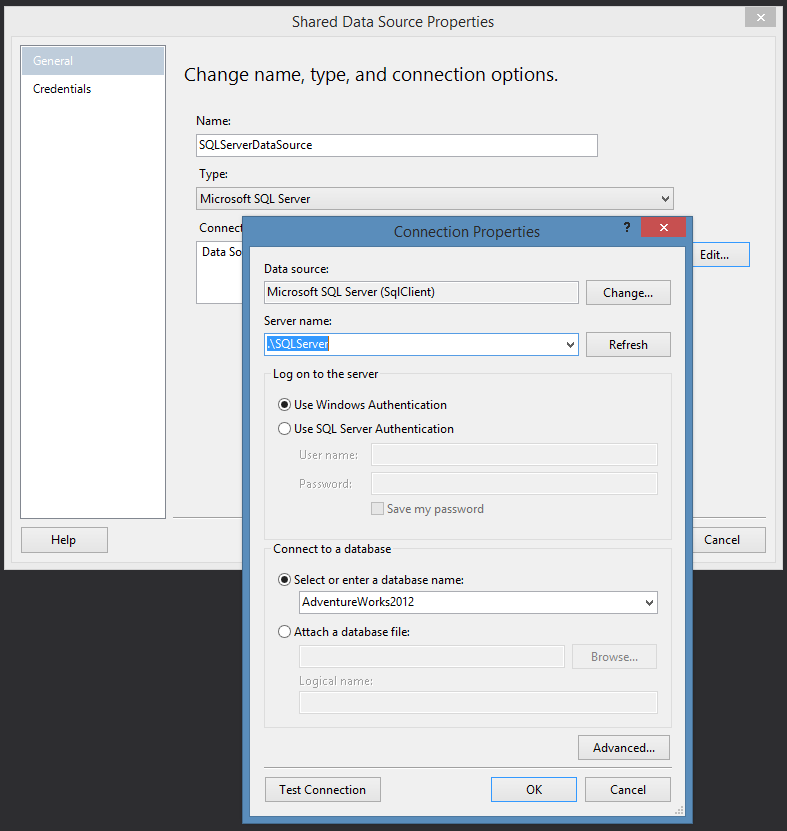
Creating a Dataset
For this initial report we are going to just do a simple output to list all of the sales people in the database along with some of their basic information. We can do this a couple ways – build the query ourselves or, if you look in the Views available in the database there is one that gets all of the Sales Person data.
Right-click on the Shared Dataset folder and Add New Dataset. In the first dialog box that comes up you name the Dataset, select your Data Source and you have a few options on how to get the data. I would say the most used options are probably Text and Stored Procedure. Note: It is always a good practice to give your Data Sources and Datasets meaningful names.
With Text selected you can write a SQL query in the textbox given that will run against the Data Source. A Query Designer is also available so you can build it and see what data will come back. In the Query Designer there are different ways to construct your query but I have only the SQL and Result Panes visible here.
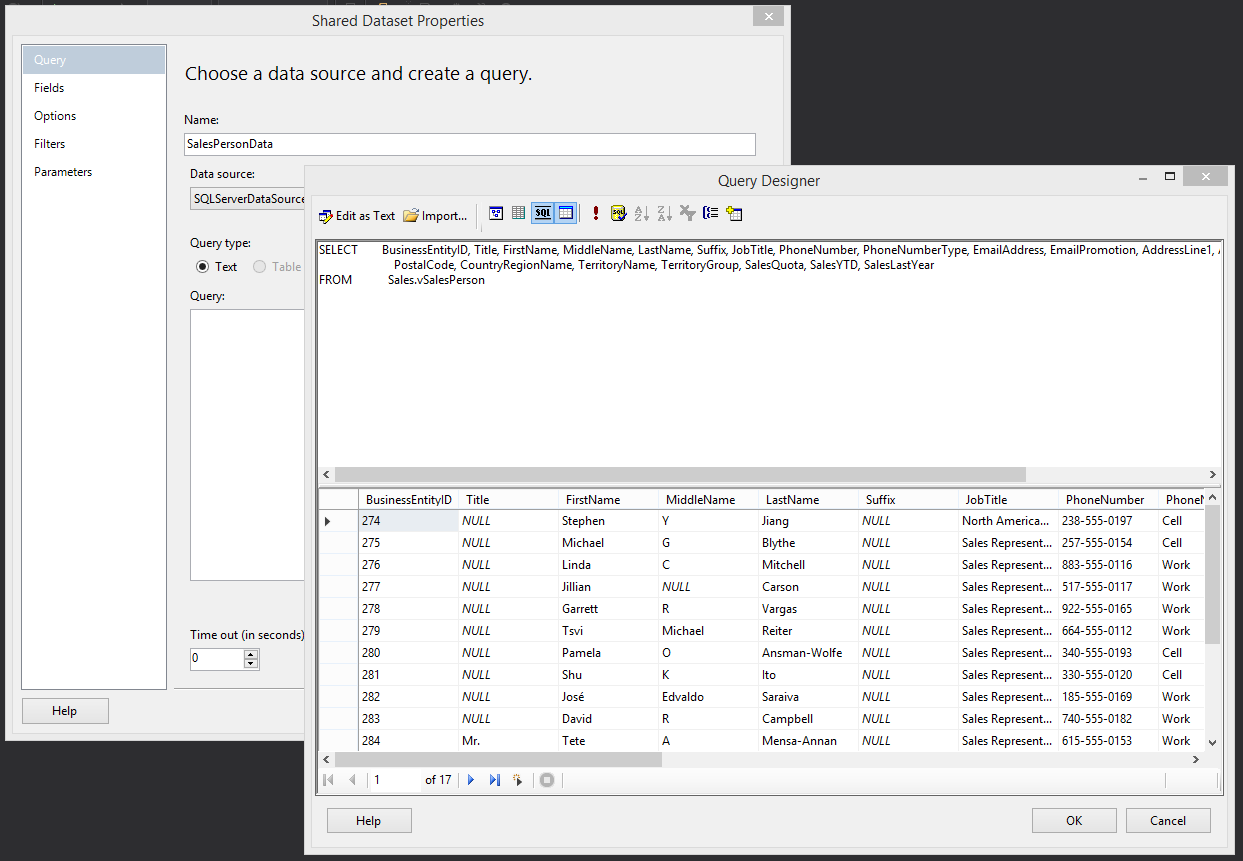
Here I am selecting all of the columns in the Sales.vSalesPerson view. Selecting OK in the Query Designer will insert your query into the text box.
Before selecting OK on the Properties window click the Refresh Fields button and then on the left side navigation go to Fields. This is a list of all of the Field items being brought in from the query. The right side is the name of the field as specified in the query and the left side is a place for you to optionally change the name of it that will be used in the reports. I recommend not changing them here but giving them an alias in the query if they need friendlier names. Refreshing the fields is not required on the creation of a query but if you ever change it to add/remove fields it will be required so I just get into the habit of hitting it with any change.
Report Setup
We have a place to get the data from and the data we want to report on so now we need a place to display it. Right-click on the Reports folder and (pay attention here) go to Add > New Item. Selecting Add New Report will send you through the Report Wizard and while it may be ok with a simple report we are doing now, it is more of a hassle when you start getting into more complicated things. Choose Report (not Report Wizard), type a name (mine is SalesPeople) and select Add.
You should see a screen similar to the one below.
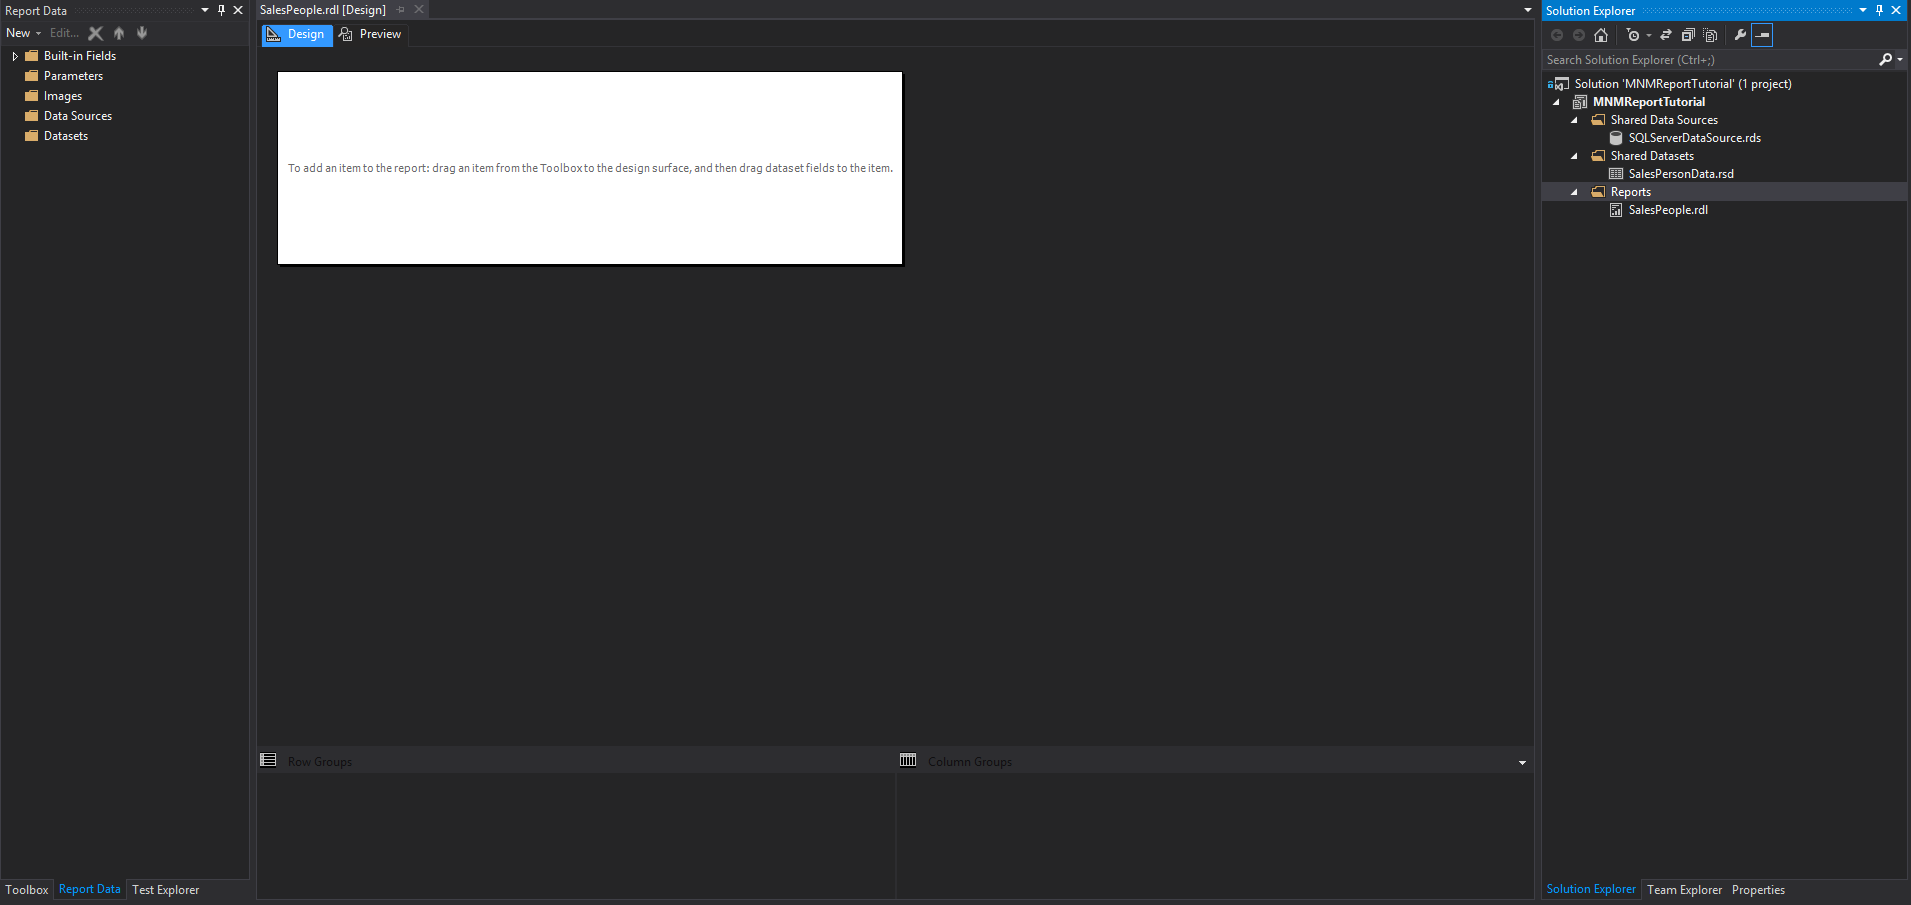
If you do not see the Report Data window, click anywhere inside the Report Design window select VIEW in the navigation and the very last item in the list should be Report Data. If the Report Design window is not the main focus then this menu item does not always show up. Some of the folders in the Report Data window should look familiar – Data Sources and Datasets. These are where you define the report specific items in each.
Like last time, we need to start out setting up the Data Source. Like I mentioned earlier you can create a Data Source that is specific to the report and I am sure there are cases where this may be needed but I would lean towards that being an exception rather than the rule. So, let’s select the option Use shared data source reference, choose our SQLServerDataSource from the dropdown list and of course give it an appropriate name.
And finally, adding our report Dataset. When creating a Dataset for the report you can choose a shared dataset or embed one in the report. For datasets I have gone more of a case by case basis on whether to use shared or embedded datasets and you can change it later on and switch to a shared dataset if you end up needing the same query in multiple reports. Here, select the shared dataset SalesPersonData, hit Refresh Fields and OK. You should now see the dataset and all of the fields available from it.
Creating a Report (Finally!)
Now we are at a point to put the pieces on the page. The next window we want to pull up is the Toolbox (VIEW > Toolbox). Let’s take a Table and drag it to the report stage. A note here – the report only ever refers to this item as a Table in the Toolbox. Once it hits the report stage any reference to it calls it a Tablix.
Visual Studio defaults the Tablix with two rows and three columns – the top row named Header and the second row named Data. Click once anywhere inside a field. A new row of grey/tan fields become visible which give you the ability to control row or column level properties.

You will notice that in the row of the Data this new box has three horizontal lines in it. This will denote a data row. This row will be repeated for each record in the Dataset it is tied to. Right-clicking any of these will bring up a menu of options to change. Left-clicking on the top left will display a move button so you can drag it around the report stage.
If you right click on the top left grey box a menu comes up; select the last item, Tablix Properties. Here you can name the Tablix select a Dataset and a whole slew of other things that we won’t go into in this post. For now, let’s rename the Tablix and select the dataset we created.
There are a few different ways to display a field in the report. One is to go back to the Report Data window, select one of the fields from the dataset and drag it to the Tablix. You will see columns light up as you hover over them and dropping the item will add the field name in the header row (which Visual Studio tries its best to predict) and the field name surrounded by brackets, which designate non-text data, in the data row. If there are no empty columns a highlighted line will appear between columns where it will add the data you have selected. Another is, if you hover your mouse over a field in the data row a small image appear. Clicking on it gives you a menu with all of the dataset’s fields and selecting one will give you the same result as the drag and drop. If you change a data field in this manner the header row will not automatically update.
After going through and adding a handful of fields I ended up with this setup.

Now let’s take a look at what we have made so far. Above the report stage there are two buttons named Design and Preview. Currently we are in Design mode because we are, well, designing the report. Click the Preview button and you will see the result of all of your hard work. No, it doesn’t look like something you would want to present to your boss or a client but it is just a step on the way to a presentation worthy report.
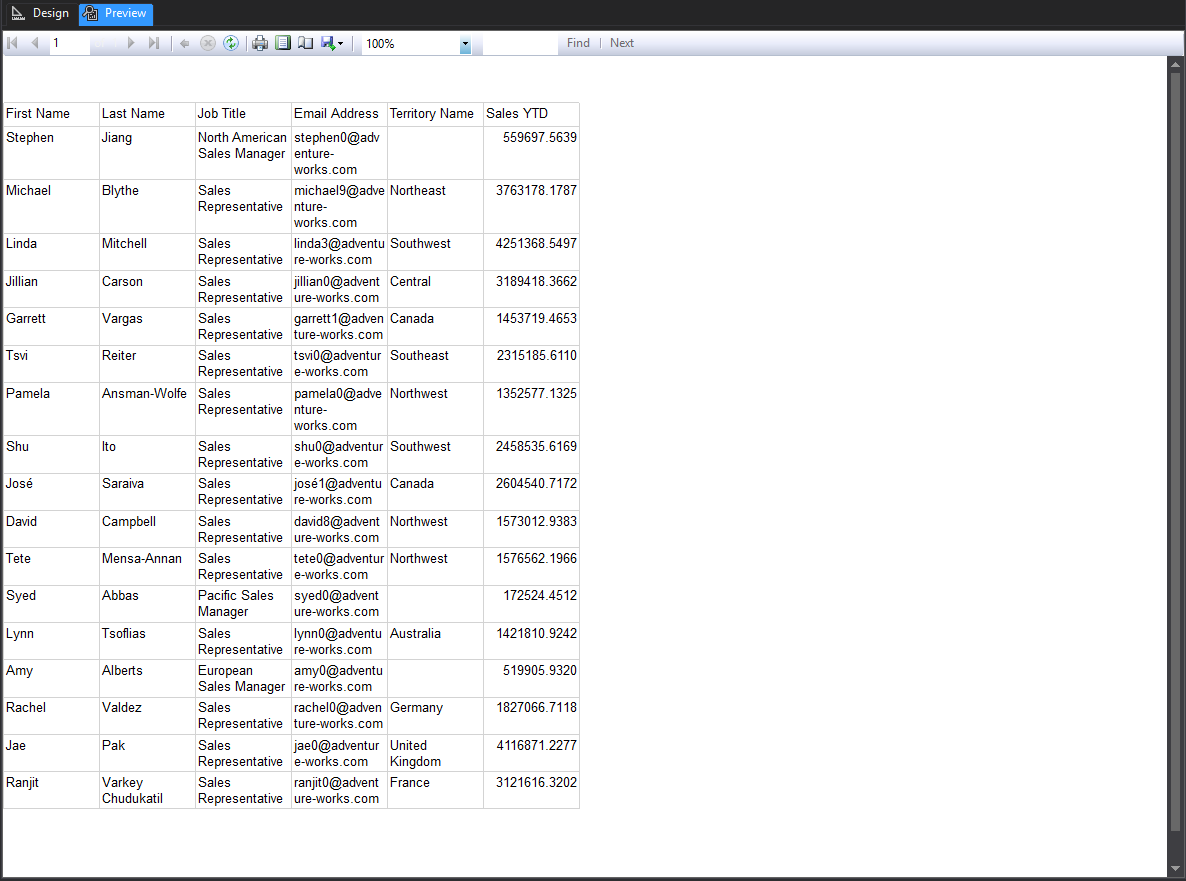
Basic Styles and Formatting
Let’s just take a couple minutes to do a bit of clean up. Switch back to Design to make these changes.
Right-click outside of the report stage (in the dark theme it is the dark grey around the report stage. You should get a menu that has a View option that will expand and allow you to check Ruler. Drag the edge of the report stage to the 8 inch mark. Using the extra grey row on the Tablix, change the width of each column to better fit the data and have the report fill the width of the report stage. You may need to switch back and forth to Preview it.
Next, click in the textbox with First Name so it has a dark border around it (when hovering it should still have a mouse pointer when you click and not a text cursor). Hold the Shift key and click in the Sales YTD textbox so the entire header row has a dark border then in the toolbar area select the B to bold all of the text in this row.
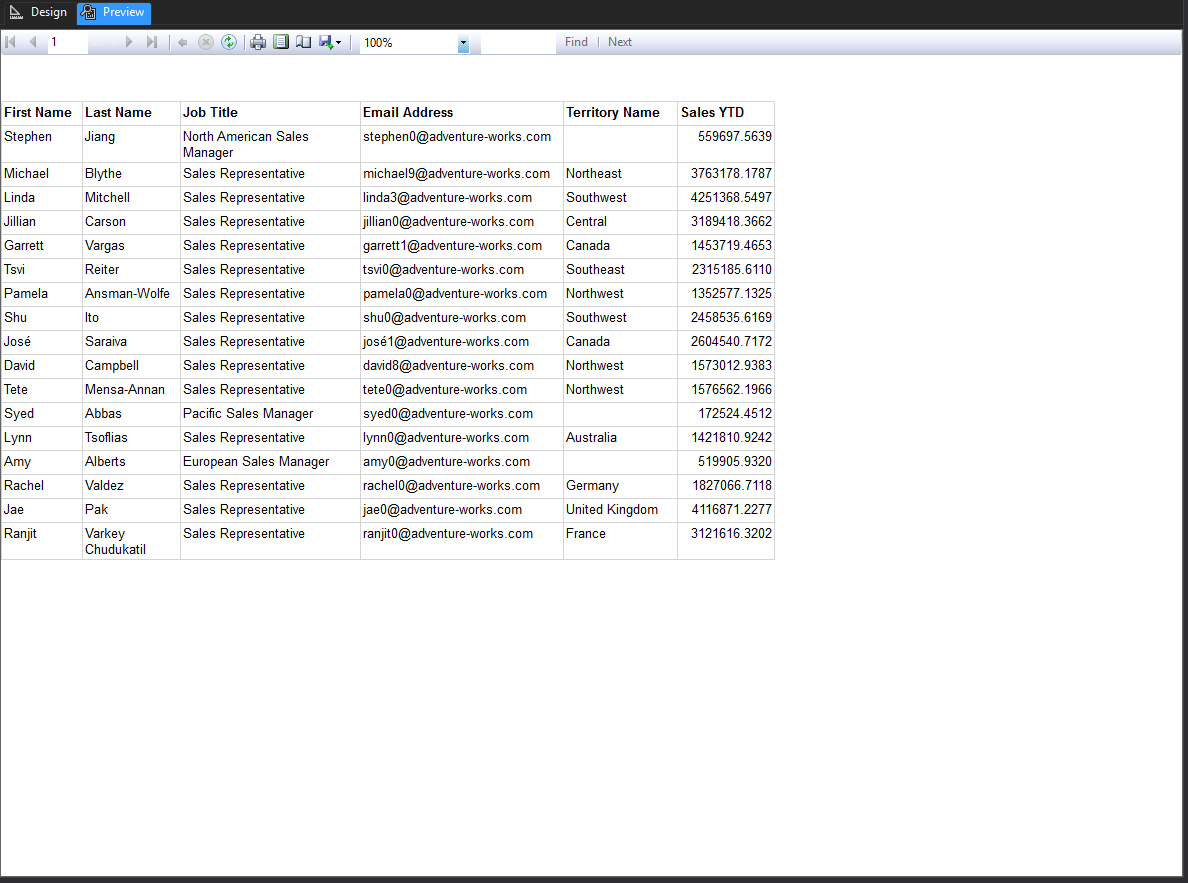
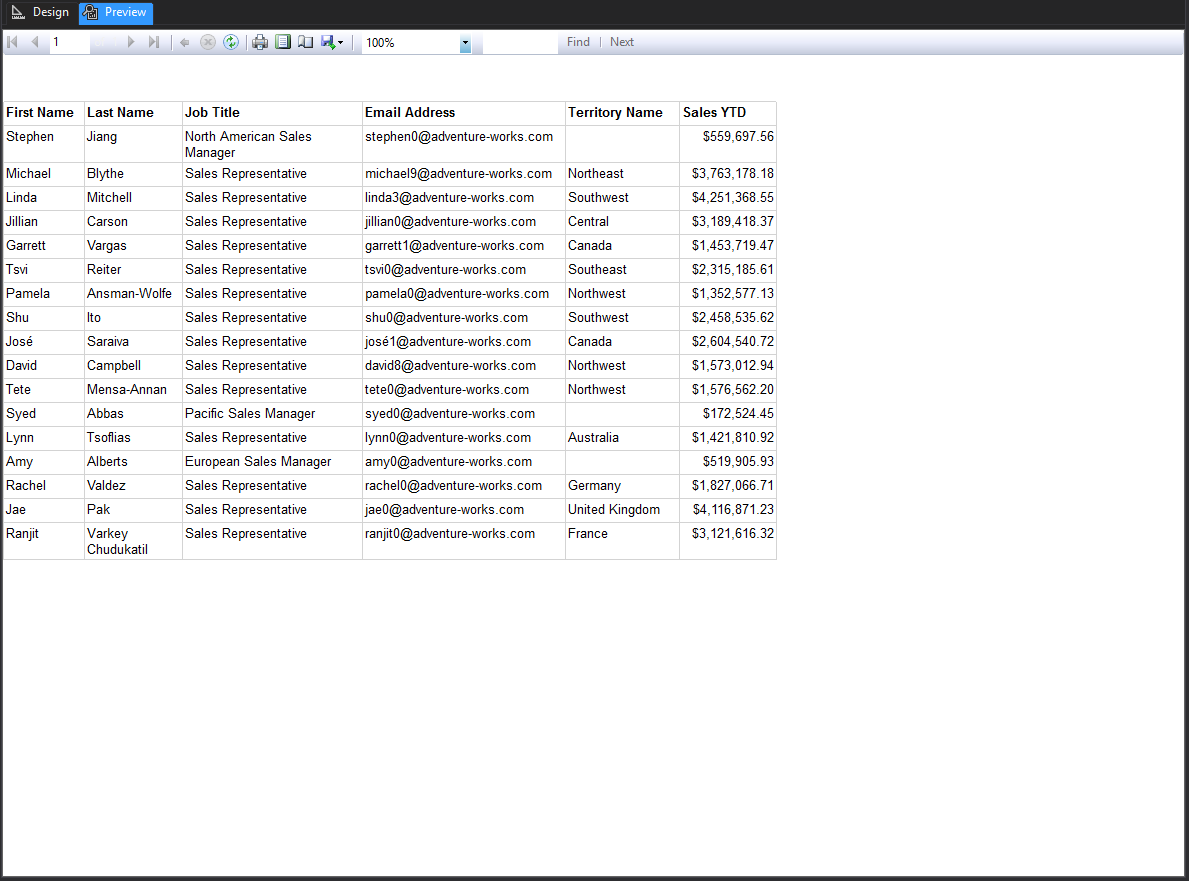
Looking better already. The last update for this post is to format the Sales YTD as currency. Back in Design mode right-click the SalesYTD data textbox and select Text Box Properties. On the left side navigation go to Number and select Currency in the Category options. Check the Use 1000 separator (,) box and leave the other options as default. One last preview to see the changes.
There are a lot of ways to display and report data in SSRS – I’m still learning new things with each report I make. A strong knowledge in building SQL queries is also very good to have because if you aren’t pulling in the correct data then no matter how interesting the report looks and how well it is presented it won’t be useful.
See Part II: Groupings or Part III: Parameters in this three part series.